
Image credit: © Jonathan Dyer-USA TODAY Sports
Introduction
For as complex as pitching is, it’s also surprisingly simple: Throw good pitches, get good results. But what defines a good pitch? Velocity, movement, location, and other variables all play roles, but condensing their impacts into a single number is difficult. Historically, teams have used a combination of scouting and on-field results to predict the quality of a pitch, but more recently they and the public have leveraged the incredible bulk of pitch data available to model the expected value of a pitch using nothing but its own characteristics and the context in which it was thrown.
We’re excited to announce the release of our own flavors of these Stuff and Pitch Quality metrics: StuffPro and PitchPro, which will be fully available on leaderboards and player cards beginning on April 1 (no foolin’). Although they resemble in many ways metrics you have seen from others, these metrics address issues we have flagged with other pitcher metrics, provide industry-leading performance, and along with established pitcher metrics like Deserved Run Average (DRA) and contextual FIP (cFIP), provide a spectrum of accuracy across which pitcher skill can be measured.
In this piece we’ll walk through how they work before focusing on how well they perform and which pitchers and pitches they like the most.
How They Work
At a high-level StuffPro and PitchPro are measures of the value of a pitch—scaled to runs per 100 pitches, with negative values favoring the pitcher—based solely on the physical characteristics of the pitch and its release, the handedness of the batter, the count in which it was thrown, and—in the case of PitchPro—the location it crossed the plate. More specifically, the metrics utilize machine learning to predict the probability of any given outcome of a pitch based on the aforementioned factors, and these probabilities are then multiplied by the run value of each potential event and summed to provide the total expected run value of the pitch. On our scales, a value of -2 for StuffPro or PitchPro is considered elite for an individual pitch and a value of -1.25 is considered elite for a pitcher’s arsenal.
If that’s all you’re interested in terms of how the metrics are created, feel free to skip ahead to the model performance and leaderboard sections. Because this is a complex topic which requires a number of assumptions made by the one modeling, we’ll spend the rest of the section laying out the methodology as thoroughly as possible.
As mentioned above, StuffPro and PitchPro are not one model, but a combination of models. Pitches are first sorted into the following broad categories:
Primary Fastballs: Four-seam fastballs, sinkers, and hard cutters. These pitch types receive the “primary” tag if they are the most common fastball the pitcher threw that game.
Secondary Fastballs: Four-seam fastballs, sinkers, and hard cutters. These pitch types receive the “secondary” tag if they are not the most common fastball the pitcher threw that game.
Offspeed: Changeups, splitters, and screwballs.
Bendy: Curveballs, sliders, sweepers, knuckle-curves, cutters, knuckle-curves, and knuckle-balls
Then, each category gets its own set of sub-models which predict the following:
Probability of a swing
Probability of a called strike, called ball, or HBP if taken
Probability of a whiff, foul, or ball in play if swung on
Value of batted ball if put into play
All models have been trained on regular-season MLB data from 2020 through 2023. The swing-probability sub-models are trained on all pitches, the take-event probability sub-models are trained only on pitches that were taken, and the swing-event probability sub-models are trained only on pitches that were swung on. Each of the probabilities are multiplied by the observed average run value of their respective events for the given count in which the pitch was thrown. The final sub-models—value of batted ball if put into play—is trained only on pitches that were put into play and uses as its target variable the expected run value of a ball in play, calculated through a KNN model that uses exit velocity, launch angle, and spray angle as its inputs. We performed extensive testing on a number of target variables for the in-play model—including predicting the probability of each discrete event (out, single, double, triple, home run), predicting the probability of a ball in play resulting in some bucket of exit velocity and launch angle, and predicting the value of a batted ball based on a model that used exit velocity and launch angle alone—and found our method to perform best at predicting the observed value of balls in play for out-of-sample pitches.
All of the inputs for each sub-model can be found in Table 1 below, split by both StuffPro and PitchPro. Note that the first nine inputs are shared between the two metrics, with PitchPro differing in how it includes velocity and movement while also adding location.
Table 1: Model Inputs Summary
StuffPro
PitchPro
Primary Fastball Model
● Season
● Horizontal and vertical release position
● Release extension
● Pitcher height
● Batter handedness
● Estimated axis differential
● Estimated spin efficiency
● Balls
● Strikes
● Release Speed
● Horizontal Movement
● Vertical Movement
● Season
● Horizontal and vertical release position
● Release extension
● Pitcher height
● Batter handedness
● Estimated axis differential
● Estimated spin efficiency
● Balls
● Strikes
● X, Y, and Z initial velocity (vx0, vy0, vz0)
● X, Y, and Z acceleration (ax, ay, az)
● Horizontal and Vertical Pitch Location
All Other Models
All of the above plus: Velocity, Horizontal Movement, and Vertical Movement differences from primary fastball’s averages for that day
Notes
All x-direction inputs are multiplied by -1 for right handed pitchers
Ball and strike count, release speed, pitch movement, and pitch location are common to nearly all pitch quality models, as these have clearly defined relationships to pitch outcomes. The rest of the inputs may not be as familiar to readers.
Season is included due to different pitch types performing differently by Most notably, sweepers performed worse in 2023 than in previous seasons, likely due to a combination of more pitchers throwing them and batters becoming more familiar with them. If one is going to use multiple seasons of data, it is important to keep track of how each pitch type’s effectiveness waxes and wanes over time.
Release point variables and pitcher height are included to provide the model with the pitchers’ estimated arm slot and to account for the initial release angle of each pitch.
Batter handedness is included to account for platoon effects. We do not include pitcher handedness as an input, but instead normalize all horizontal input variables such that negative values indicate the glove side.
Estimated axis differential is the difference between the observed spin axis of the pitch and the inferred spin axis based on the pitch’s movement.
Estimated spin efficiency is the difference between the observed spin rate and the inferred spin rate based on the pitch’s movement.
Estimated axis differential and spin efficiency are included as proxies for seam-shifted wake effects, which results in pitch movement not accounted for by the magnus force. It is believed that non-magnus movement is “unexpected” to the batter, and thus has an independent relationship to pitch outcomes beyond movement itself.
Initial velocity and accelerations split into their individual components in the x, y, and z direction are included due to the impact on pitch results due to the release trajectory of the pitch. These are not split into their individual components for the StuffPro model, as doing so would allow the model to “infer” the final pitch location.
Velocity and movement differences from the pitcher’s primary fastball are included in other public stuff models as well, and account for how a pitcher’s overall arsenal affects how a pitch performs.
Philosophically, we choose to be very stingy about adding inputs to the model. Machine learning methods are prone to overfitting, so it’s important to not provide the model with more opportunities to do just that. To that end, we only include an input if 1) we can articulate the causal pathway through which it would impact the outcome of a pitch and 2) if it improves out of sample performance of the model. I won’t walk through just how many inputs didn’t make the cut for one or both of these reasons, but the most notable ones missing are spin rate, VAA (vertical approach angle), and HAA (horizontal approach angle). Spin rate proved to be redundant, as its impact passes through movement and spin efficiency. VAA and HAA do have independent causal impacts on pitch outcomes even when controlling for the other inputs, but including them did not improve out of sample performance. The reason for this is likely that the model effectively “knows” VAA and HAA based on the other inputs, and thus they become redundant as well. Other model structures may find different results when testing these other inputs, but ultimately we did not have a performance-related reason to include them.
For all of our models we’ve chosen to use CatBoost. CatBoost belongs to a family of machine learning models called gradient boosting. These models operate by creating a set of decision trees which map the input variables to a given target variable. The benefits of these methods are that they are extremely flexible and can handle complex interactions between a large number of inputs. Their downside, in terms of modeling performance, is if not handled properly they have a tendency to overfit to the training data and effectively return something akin to the observed target variable as the modeled output variable. The three most popular gradient boosting tools are CatBoost, XGBoost, and LightGBM. LightGBM is extremely fast, but it struggles to match the performance of the other two. XGBoost is capable of performing similarly to CatBoost on large datasets, however it requires a much larger amount of hyperparameter tuning compared to CatBoost. We have found CatBoost to best prevent overfitting, though at the cost of additional computation time. This is particularly true when using categorical variables as inputs, such as season or batter handedness.
How They Perform: Sub-Model Calibration
Now that we have the nerdery out of the way, let’s focus on something more fun: How well the models perform. Since the models are built from the ground up, we’re going to present the model performances from the ground up, starting with the predictions of the sub-models. Below we’ve plotted the average observed value of a given target variable based on the average predicted value of the model’s output, with the size of each point determined by the number of pitches with that average predicted value. Ideally, one should see events with a predicted probability of 50% occurring 50% of the time, continuing for all other probabilities.
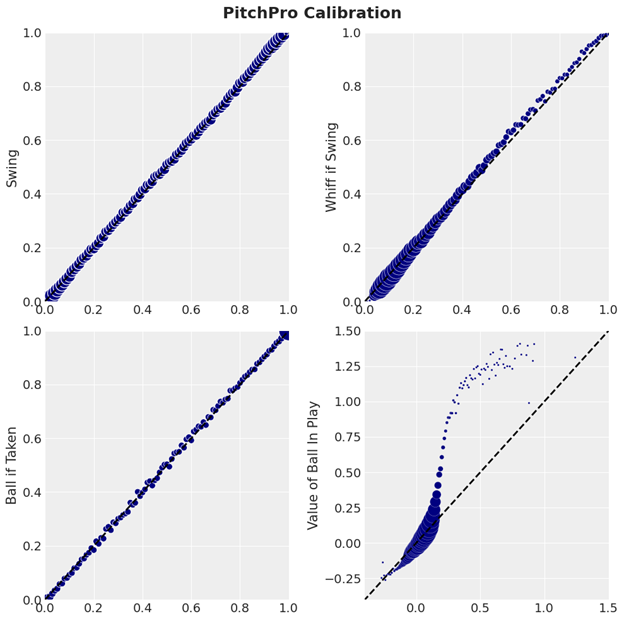
For the PitchPro model we see the swing, whiff, and called ball models are extremely well calibrated, with the results matching the predictions on average for each average value of the prediction. The shape of the ball in play value model may appear strange at first, but it’s due to the fact that the model is extremely hesitant to predict a value for a ball in play greater than around 0.25 runs. We see this as a feature rather than a bug, as these high-value balls in play are both relatively rare and also partially credited to the identity of the batter at the time.
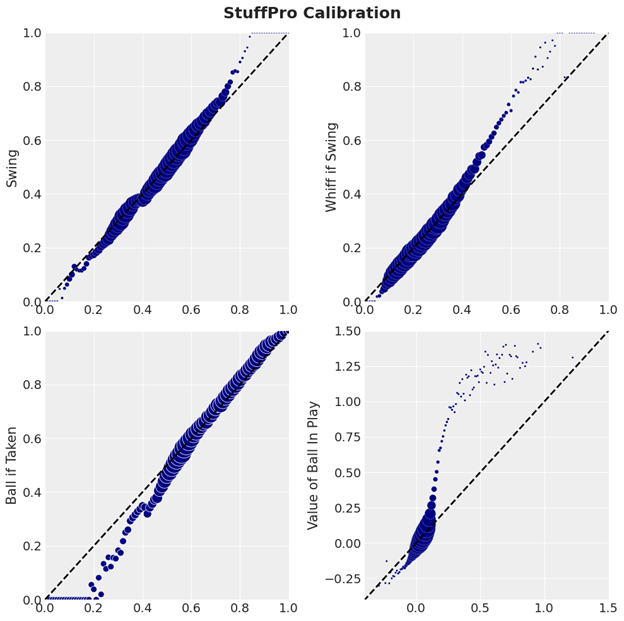
The shape of the StuffPro predictions appears both nonlinear at the margins and significantly shrunk relative to the observed values. This is due to the models not including the location of the pitch. However, for the bulk of pitches the model’s predictions align well with the target variables.
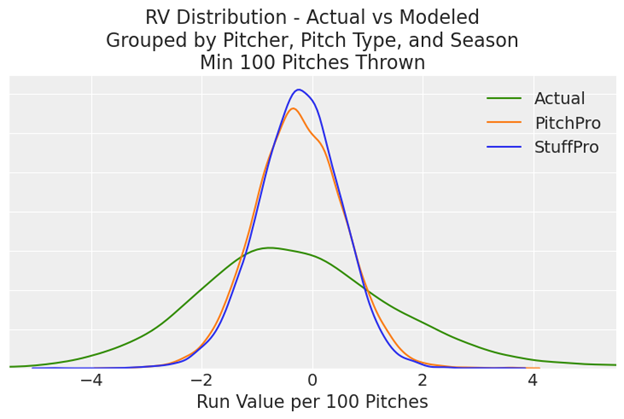
As mentioned previously, by multiplying these predictions by the value of their respective outcomes we are able to calculate the total predicted value of a pitch. As expected, these predicted values cover a narrower range than the observed values of the pitches. This can be seen in the table below: The standard deviation of the observed run value of pitches in the sample is over five times greater than the standard deviation of PitchPro, which in turn is three times greater than that of StuffPro.
Table 2: Distribution of StuffPro, PitchPro and Run Value per 100 Pitches(2020-2023)
StuffPro
PitchPro
Run Value
Mean
-0.29
-0.31
-0.44
Standard Deviation
1.7
5.1
26.0
Min
-29.7
-32.8
-307.2
Max
102.1
117.2
509.6
When we aggregate pitches by the pitcher on the mound, the pitch type, and the season in which it was thrown we see much of the spread in PitchPro gets shrunken toward the center to closer match that of StuffPro. This is due to the fact that when we group by pitcher the variation in PitchPro due to location gets averaged out, making its physical characteristics relatively more important to its value, and thus bringing its distribution closer to that of StuffPro.
Finally, if we split things by pitch type grouped by pitcher we find narrower and broader distributions for different types. The model sees a wide range of values for fastballs and changeups, each centered around zero. Sliders on the other hand are viewed much more favorably, with even the average slider exhibiting a negative StuffPro value.

How They Perform: Predicting Performance
This leads us to the most exciting part of the model results: how well they predict performance. We’ll begin by presenting how well the models capture the value of a pitch in a given season. For the table below we’ve aggregated each pitch by its type, the pitcher on the mound, and the season it was thrown. We then calculated the Spearman rank correlation between the observed run value of that pitch and its StuffPro or PitchPro value, weighting our correlations based on the number of pitches thrown. PitchPro correlates better than StuffPro for most pitch types, with the difference in the correlations likely driven by how much that pitch type’s value is tied to where it is thrown. This is most clearly seen in how well StuffPro describes the value of sliders, performing slightly better than PitchPro[1]. Alternatively, there is a large gap in the correlations for four-seam fastballs, as those pitches’ value vary greatly with where they are thrown.
Table 3: Pitch Type Correlation to Same-Season Run Value(2020-2023, weighted Spearman by pitches thrown)
Pitch Type
StuffPro Descriptiveness
PitchPro Descriptiveness
Sample Size
HC
.57
.61
57
FA
.37
.47
1641
SI
.40
.42
950
SW
.33
.39
347
SL
.35
.35
1109
KC
.39
.46
245
CU
.42
.50
644
FC
.24
.24
379
FS
.41
.43
156
CH
.40
.46
1205
Next, we look at how well the models predict their own values and the observed run values of each pitch in the following season. The columns labeled “Reliability” refer to this self-correlation, while “Predictiveness” refers to its correlation with next season run value. For these we again used Spearman correlations, though this time they are weighted by the average number of pitches thrown across the pair of seasons. The predictiveness results are largely reversed from what we saw above, with StuffPro revealing itself to be much more reliable and predictive than PitchPro. This is due to the noisiness in how well a pitcher commands their pitches coupled with the wide range of predicted values of a pitch based on location. For example, a fastball in the heart of the zone is much less valuable than one on the edge, even though those pitches may be less than a foot apart. Numerous pieces of research on command have found that on average pitchers likely miss their intended locations by somewhere between 6 and 12 inches, therefore requiring a large number of pitches before the true value of their targets and command are revealed.
Table 4: Pitch Type Correlation to Next Year Self and Next Year Run Value(‘20-’22/’21-’23, weighted Spearman by average pitches thrown)
Pitch Type
StuffPro Reliability
StuffPro Predictiveness
PitchPro Reliability
PitchPro Predictiveness
HC
.84
.51
.69
.46
FA
.80
.31
.62
.30
SI
.73
.23
.55
.20
SW
.67
.32
.42
.26
SL
.77
.29
.51
.19
KC
.82
.27
.55
.23
CU
.80
.34
.61
.30
FC
.75
.20
.46
.11
FS
.79
.37
.56
.21
CH
.79
.32
.60
.25
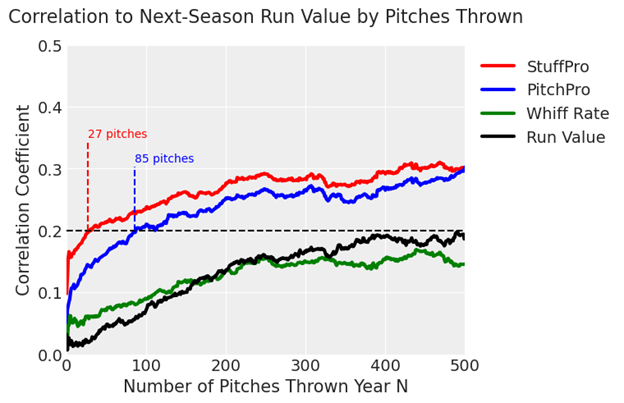
Looking more granularly at the metrics’ reliability, the plot below presents the split-half correlation of each metric based on the number of pitches thrown. These are calculated by taking a set number of pitches, splitting that set in two, and then calculating how well the pitches’ values for the given metric in one split-half correlate with the values in the second split-half when averaged by pitcher and pitch type. We’ve added a line for the whiff rate of a pitch to provide reference for the models’ performances. We find that StuffPro takes very few pitches to “stabilize” and become reliable, with PitchPro performing roughly on par with whiff rate.
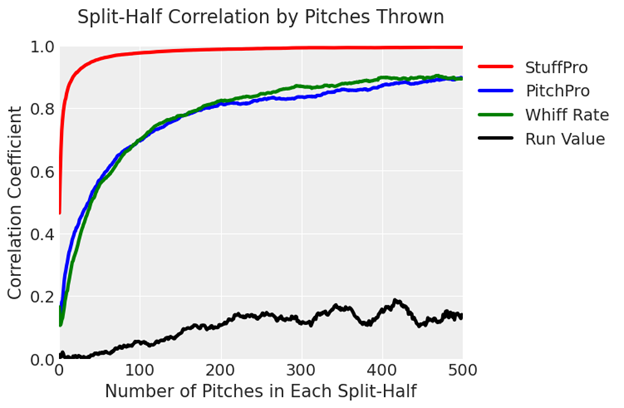
Combining the reliability of these metrics and their predictive ability at the pitch-level gives us a way to predict the quality of a pitch with an extremely small sample size. To note: The observed run value of a pitch doesn’t achieve a 0.2 correlation to its run value in the subsequent season until roughly 500 pitches. StuffPro on the other hand reaches this level of correlation after just 27 pitches, and PitchPro isn’t far behind at 85 pitches. StuffPro’s predictive power remains greater than PitchPro until around that 500 pitch mark, at which point the noise associated with the location of a pitcher’s pitches begins to show more signal.
While the purpose of these models is not to predict overall pitcher performance, their predictiveness at the pitch-level does carry over to the overall pitcher-level. In the table below we’ve presented the same Reliability and Predictiveness scores as above, though this time we’ve grouped our metrics at the pitcher level and are calculating Predictiveness based on a pitcher’s RA9 and weighting by average IP across the two seasons. At this task, our models outperform all other publicly available pitcher metrics.
Table 5: Pitch Metric Correlation to Next Year Self and RA9(‘21-’22/’22-’23, weighted Spearman by average IP)
Metric
Reliability
Predictiveness
StuffPro
.74
.29
PitchPro
.54
.29
DRA
.41
.27
cFIP
.43
.28
xERA
.30
.22
FIP
.22
.18
ERA
.16
.15
Last year, we expressed concern about existing metrics having a wide gulf in predictiveness based on whether a player switched or remained with his previous team. Although not conclusive, this suggested that existing metrics were picking up too much signal from the team and excessively crediting the pitchers for it. StuffPro and PitchPro minimize this deficiency, and their performance remains strong whether we look at all pitchers, at those who switched teams during or between seasons, or at those who remained on the same team, indicating that the model is doing a better job separating pitchers from their team or ballpark.
Table 6: Pitch Metric Correlation to Next Year RA9(‘21-’22/’22-’23, weighted Spearman by average IP)
Metric
All Pitchers
Team Switchers
Team Remainers
StuffPro
.35
.29
.37
PitchPro
.32
.29
.34
DRA
.31
.27
.32
cFIP
.34
.28
.38
xERA
.27
.22
.29
FIP
.26
.18
.29
ERA
.20
.15
.20
Finally, there does reach a point when a pitcher’s results are due to more than the quality of their pitches. We’ve recalculated our reliability and predictiveness metrics below, this time using unweighted Spearman correlations for all pitchers with at least 150 innings pitched in the first season and 50 innings pitched in the next. In this sample of 103 pitchers, PitchPro outperforms StuffPro in predictiveness, with both being outperformed by DRA and cFIP. There’s enough randomness in small samples of pitching that hard skills—the types of things captured by a Stuff model—dominate differences between pitchers. However, given enough appearances things like command, deception, timing, and pitch mix contribute in ways that reveal themselves in the results and are captured by our other metrics.
Table 7: Pitch Metric Correlation to Next Year Self and RA9(‘21-’22/’22-’23, Spearman, Min 150 IP in first season and 50 IP in next)
Metric
Reliability
Predictiveness
StuffPro
.91
.51
PitchPro
.81
.53
DRA
.67
.54
cFIP
.72
.56
xERA
.55
.45
FIP
.45
.41
ERA
.35
.36
Leaders
Now that we know what the models are, how they work, and how they perform, we’ll take a look at which pitches and pitchers it likes the most. We’ll start with the 10 best pitches by StuffPro in 2023, minimum 100 pitches thrown.
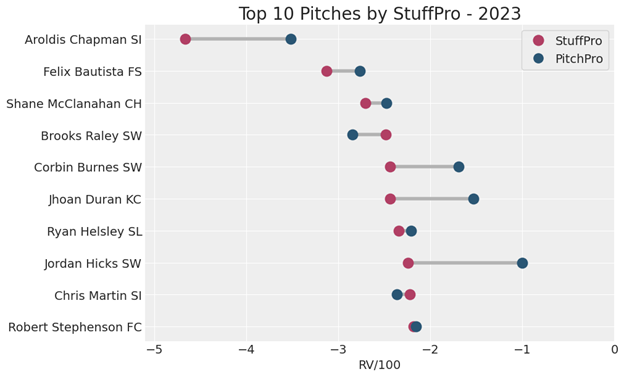
Chapman’s sinker completely destroys our scaling, with the model rating it as -5 runs per 100 pitches according to StuffPro. After that we see a collection of pitches dominated by sliders and sweepers in a range from -2 to -3 StuffPro.
Looking at pitchers’ entire arsenals, we find a list of relievers topping the leaderboards with Spencer Strider’s name thrown in for good measure. Note that for these we filtered for pitchers with at least 500 pitches thrown in 2023.
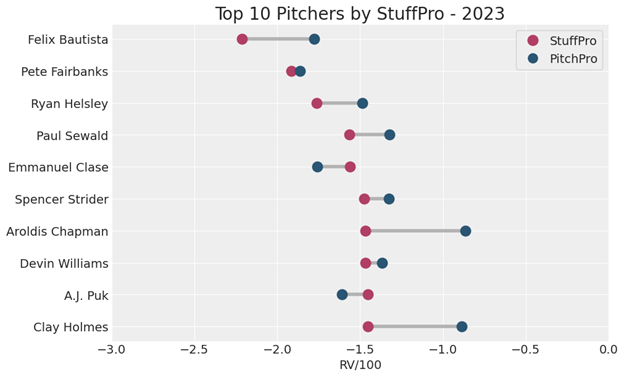
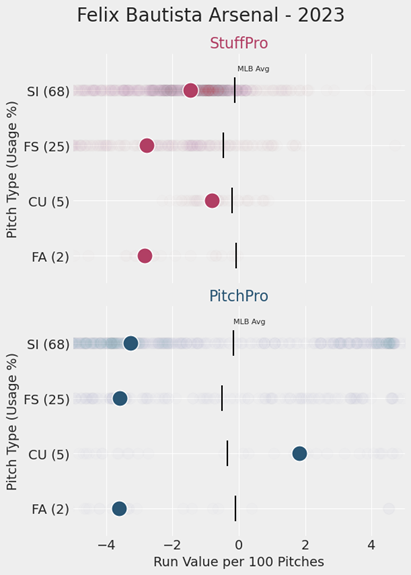
Unsurprisingly, we see some repeat names from the previous chart of top 10 pitches. Notably, Bautista’s fastball coupled with his nasty splitter made him one of the most feared relievers in baseball before suffering a UCL injury in late August. The plot below shows the StuffPro and PitchPro value of each pitch he threw in 2023, with his median value for each pitch highlighted.
Conclusion
StuffPro and PitchPro can be found on our leaderboard pages [** complete later **] for the 2020 through 2024 seasons and will become a staple in our pitch evaluations moving forward. We’re excited for our readers to dig in and look forward to your feedback as you begin using these new metrics.
Appendix 1: Model Inputs Summary
StuffPro
PitchPro
Primary Fastball Model
● Season
● Horizontal and vertical release position
● Release extension
● Pitcher height
● Batter handedness
● Estimated axis differential
● Estimated spin efficiency
● Balls
● Strikes
● Release Speed
● Horizontal Movement
● Vertical Movement
● Season
● Horizontal and vertical release position
● Release extension
● Pitcher height
● Batter handedness
● Estimated axis differential
● Estimated spin efficiency
● Balls
● Strikes
● X, Y, and Z initial velocity (vx0, vy0, vz0)
● X, Y, and Z acceleration (ax, ay, az)
● Horizontal and Vertical Pitch Location
All Other Models
All of the above plus: Velocity, Horizontal Movement, and Vertical Movement differences from primary fastball’s averages for that day
Notes
All x-direction inputs are multiplied by -1 for right handed pitchers
[1] The table shows equivalent values due to rounding; the raw value is slightly stronger for StuffPro.
Thank you for reading
This is a free article. If you enjoyed it, consider subscribing to Baseball Prospectus. Subscriptions support ongoing public baseball research and analysis in an increasingly proprietary environment.
Subscribe now


